
Uptime Monitor
Uptime checks across the US.
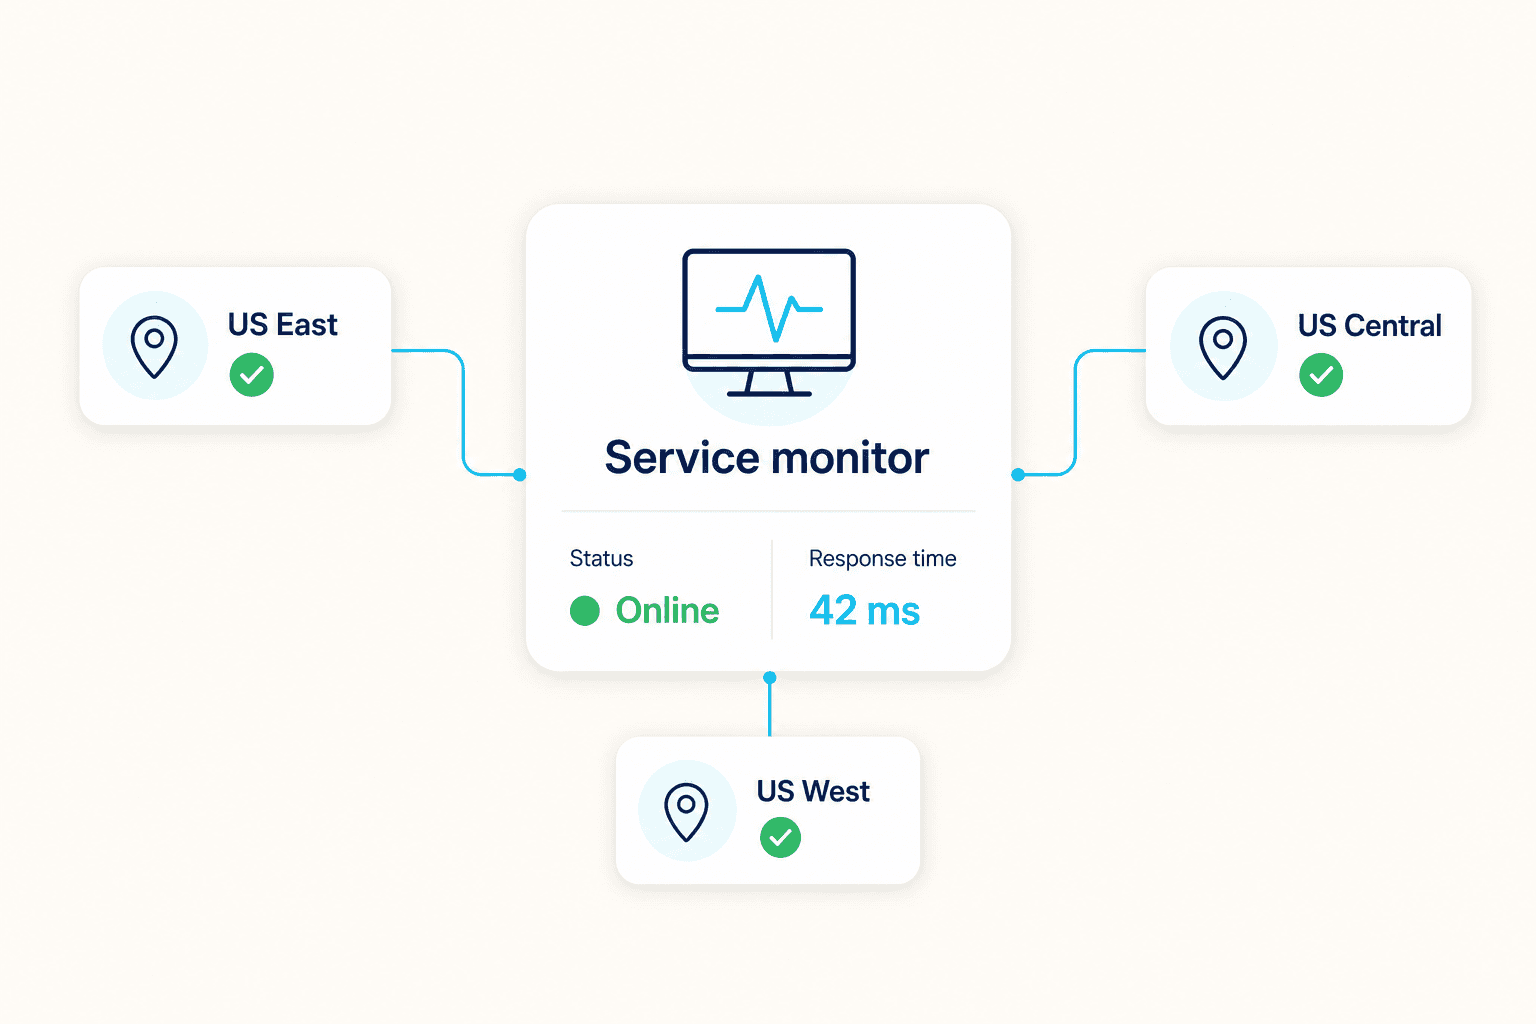
For teams running NaaS capacity side by side with Nexari, Uptime Monitor adds regional checks so one bad path does not skew your view. You get status and latency per region. Incidents, alerts, and Watchdog tie into the same screens you already use.
Nexari Uptime Monitor for network operators
Nexari Uptime Monitor adds ping monitoring and regional uptime visibility inside Nexari for teams that operate Network-as-a-Service (NaaS) workloads. Checks run from multiple US regions so latency and availability reflect real routing paths, not a single probe.
You see status and response times per region on an operational dashboard, open each monitor for history and charts, and export historical latency data when you need audits or offline analysis. Web and push notifications, incident review, and Watchdog automation sit alongside the same monitors.
Nexari is built as a multi-tenant control plane for services commonly coordinated with provider API integrations, scheduling bandwidth, governing tenants, and now monitoring uptime in one place.
Coverage
More than one place checks your targets.
Routing and DNS can look fine from one city and not another. Multiple probes help catch that.
US Central
Checks from the middle of the country.
US East
East coast coverage for latency issues you might miss inland.
US West
West coast checks for coast-to-coast paths.
Platform monitoring
Core uptime tools in one place.
Multi-data-center checks
Checks run from more than one region. If one site has trouble, you still see what customers hit elsewhere.
Per-region status and latency
Up or down and response time per region. Each target also has an overall roll-up.
Operational dashboard
Search monitors, refresh lists, turn checks on or off, and jump into detail when you need it.
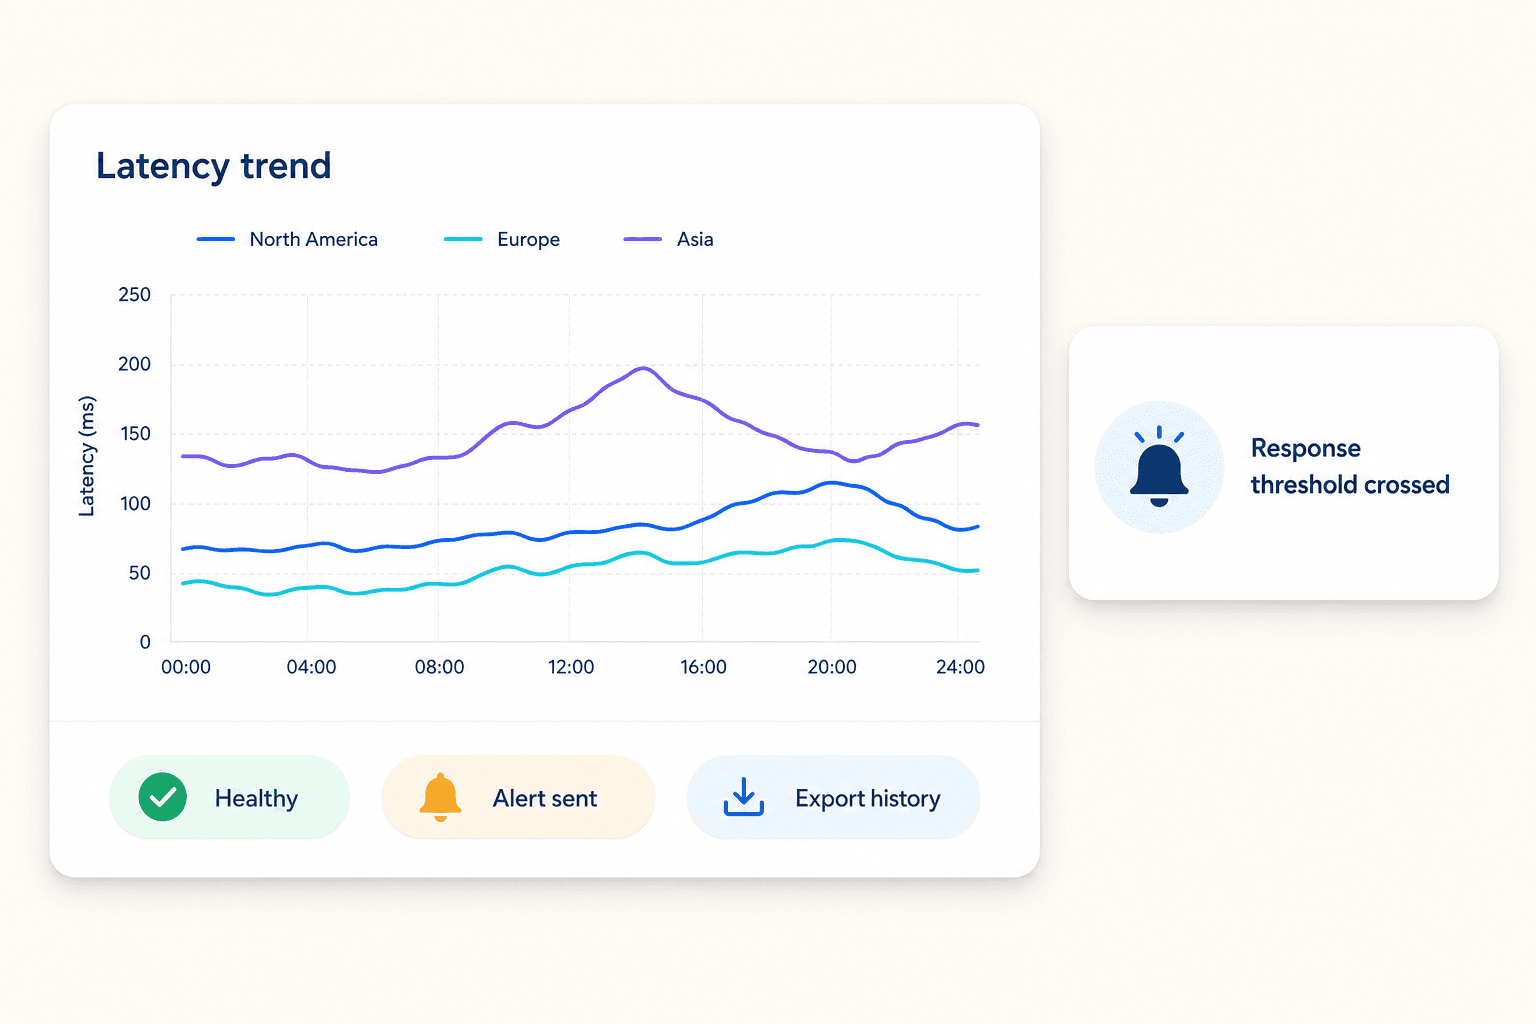
Export historical latency data
Download history for audits, planning, or work outside Nexari.
Advanced capabilities
Alerts, incidents, and automation.
Web and push notifications
Get alerts in the web app and on your phone when a monitor changes state or crosses a threshold.
Incident management
See what triggered downtime, compare regions, and follow an incident until it is closed.
Watchdog integration
Let Watchdog respond when ports or services go down, using flows that match how your team works.
Monitor detail
History, latency, and incidents per monitor.
Pick a monitor to see uptime by region and latency charts. You can export data, pause checks, or edit settings. All of it stays inside your tenant.
FAQ
Uptime Monitor, NaaS, and ping monitoring
- What is Nexari Uptime Monitor?
- Nexari Uptime Monitor is a feature inside Nexari that runs uptime checks from several US regions, charts latency, exports historical latency data, and routes incidents through alerts and Watchdog automation.
- How does ping monitoring fit into Nexari?
- Operators configure monitors against targets they care about, view regional availability and latency, and drill into per-monitor history. Ping monitoring-style uptime checks complement Nexari scheduling and broader resilience tooling.
- Does Nexari Uptime Monitor relate to NaaS and provider APIs?
- Nexari is built as an operational control plane for teams managing NaaS services. Organizations that integrate provisioning or lifecycle flows via provider APIs typically coordinate uptime visibility alongside Internet on Demand operations inside Nexari.
Next step
Want Uptime Monitor on your account?
We can walk through monitors per Port, how you want to be notified, and Watchdog setup for your tenants.